The Ultimate Burn-Up Chart Excel Template
You love the idea of showing off your Scrum Team’s progress visually with a burnup chart. You don’t love the idea of spending hours fiddling with Excel charts and formulas to create a burnup chart. You’ve probably tried using the native progress reports in Jira or another agile planning tool and learned that the charts won’t look right unless your team updates every user story in the backlog and makes intolerable changes in how the tool is used.
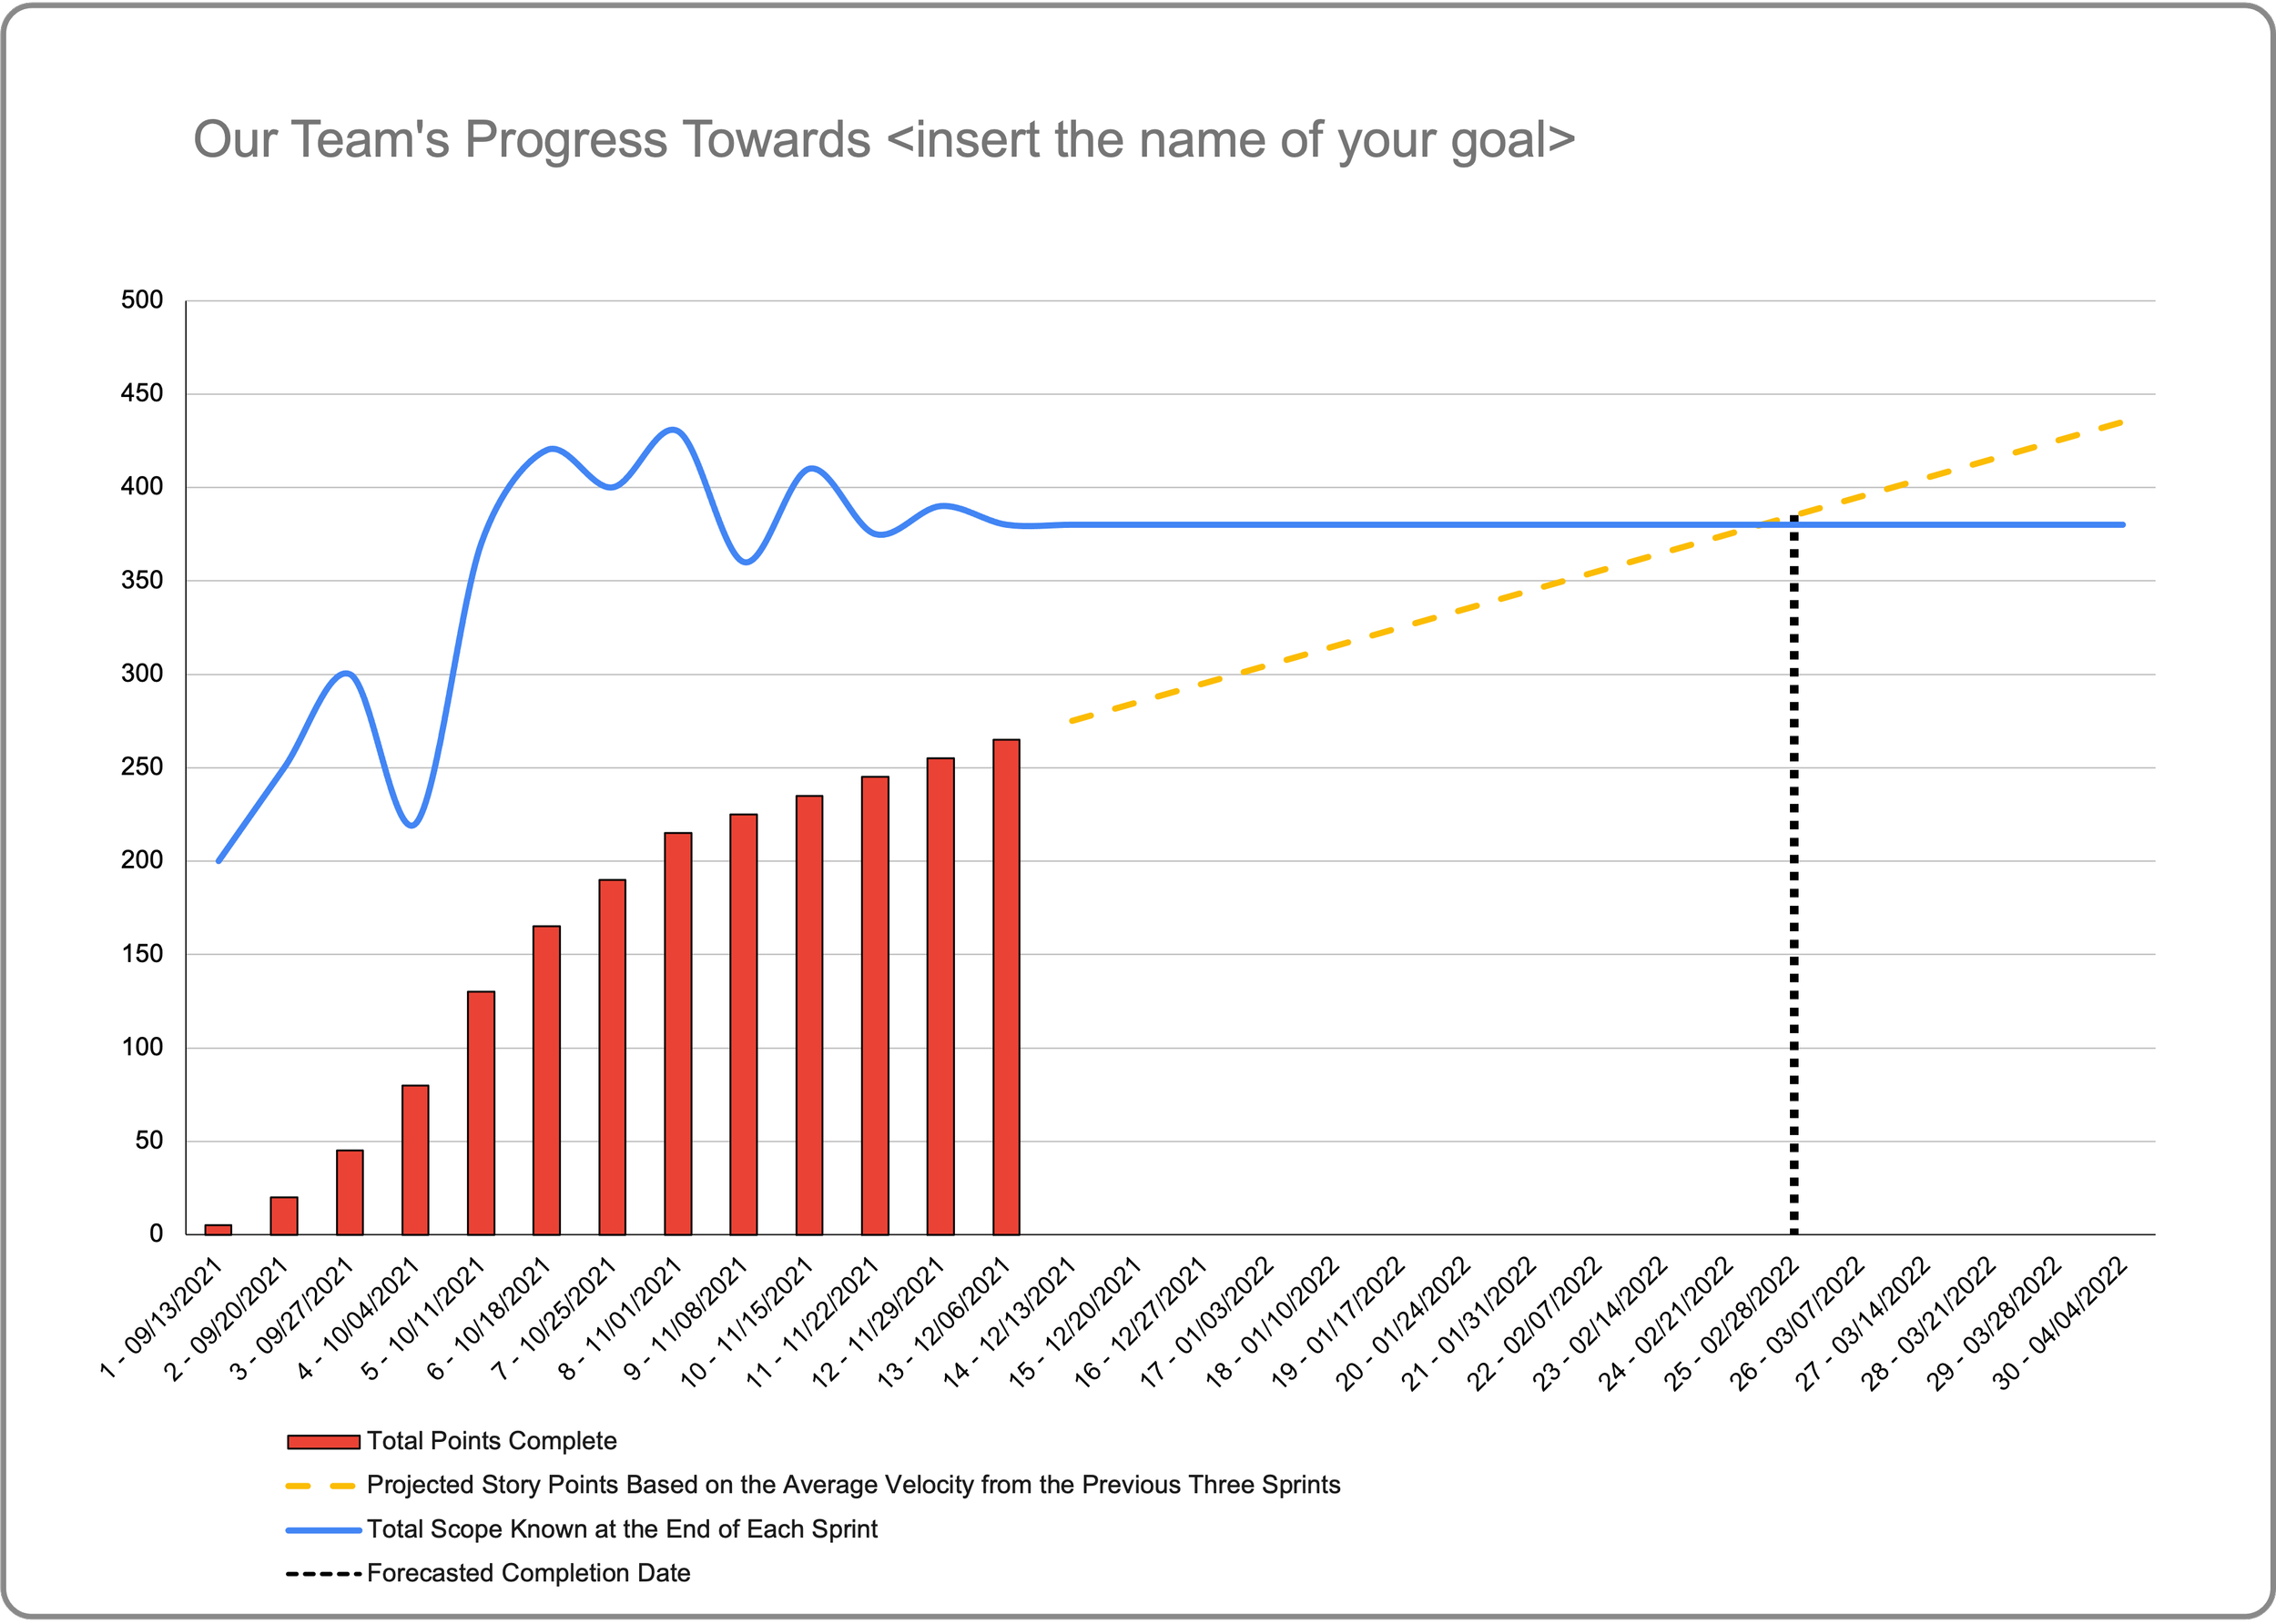
So, for you, I present The Ultimate Burn-Up Chart Excel Template. To get started impressing your customers, stakeholders and executives with beautiful burnup charts at your next sprint review, all you’ll need is your Scrum team’s velocity and the number of story points (or whatever units you prefer) required to reach your next goal. You can create a burnup chart like the one below in minutes. Enjoy!
Download Link: https://bit.ly/ultimate-burnup